Add charts and lists to your Home page, so the numbers you check most are waiting when you sign in.
What you can see and do depends on how your agency set up your access. If something here isn't on your screen, ask your agency.
Do this
| 1 | Go to Home and choose ADD. |
| 2 | Choose Chart/List or Statistic, then ADD. |
| 3 | Choose a Source (see below) and give it a title. |
| 4 | Choose ADD. It appears on your Home page. |
Adding to your dashboard
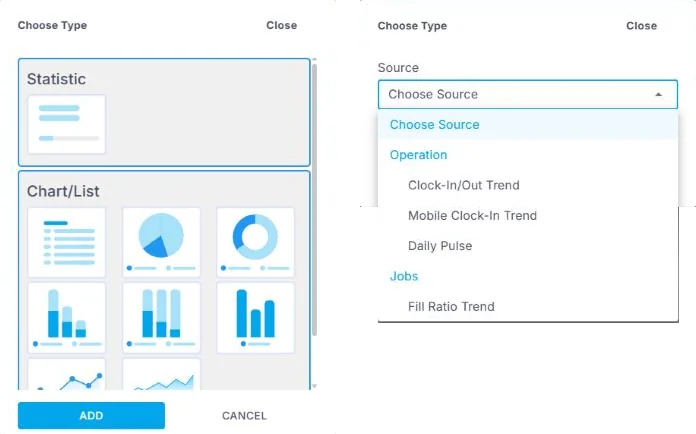
Choose ADD on Home, pick a Statistic or a Chart/List, then ADD. Next, choose a Source, such as Daily Pulse or Fill Ratio Trend, and give it a title.
What you can add
Daily Pulse: today's Crew, their jobs and who is on site.
Clock-In/Out Trend: how many people were early, on time or late.
Mobile Clock-In Trend: how many clocked in on the app.
Fill Ratio Trend: how many jobs were filled compared with how many you ordered.
If this doesn't work
| What you see | What to do | Who fixes it |
|---|---|---|
| A source isn't in the list | Your agency decides what data you can see. | Your agency |
| The chart is empty | Change its date range, or check you have jobs in that period. | You |
Only your agency can
- Share more data with you.
Call or email your contact at your staffing agency.
Other ways people ask this
- How do I add a dashboard?
- How do I see who is on site today?
- How do I track on-time?
- How do I see my fill rate?
Related guides
If your agency's site has its own name and logo, it is powered by NextCrew and works the same way.
Was this article helpful?
That’s Great!
Thank you for your feedback
Sorry! We couldn't be helpful
Thank you for your feedback
Feedback sent
We appreciate your effort and will try to fix the article